
HG-V03 Orthophoto survey · OrthoGraphic AI
Everything you can see in the aerial image, as GIS layers.
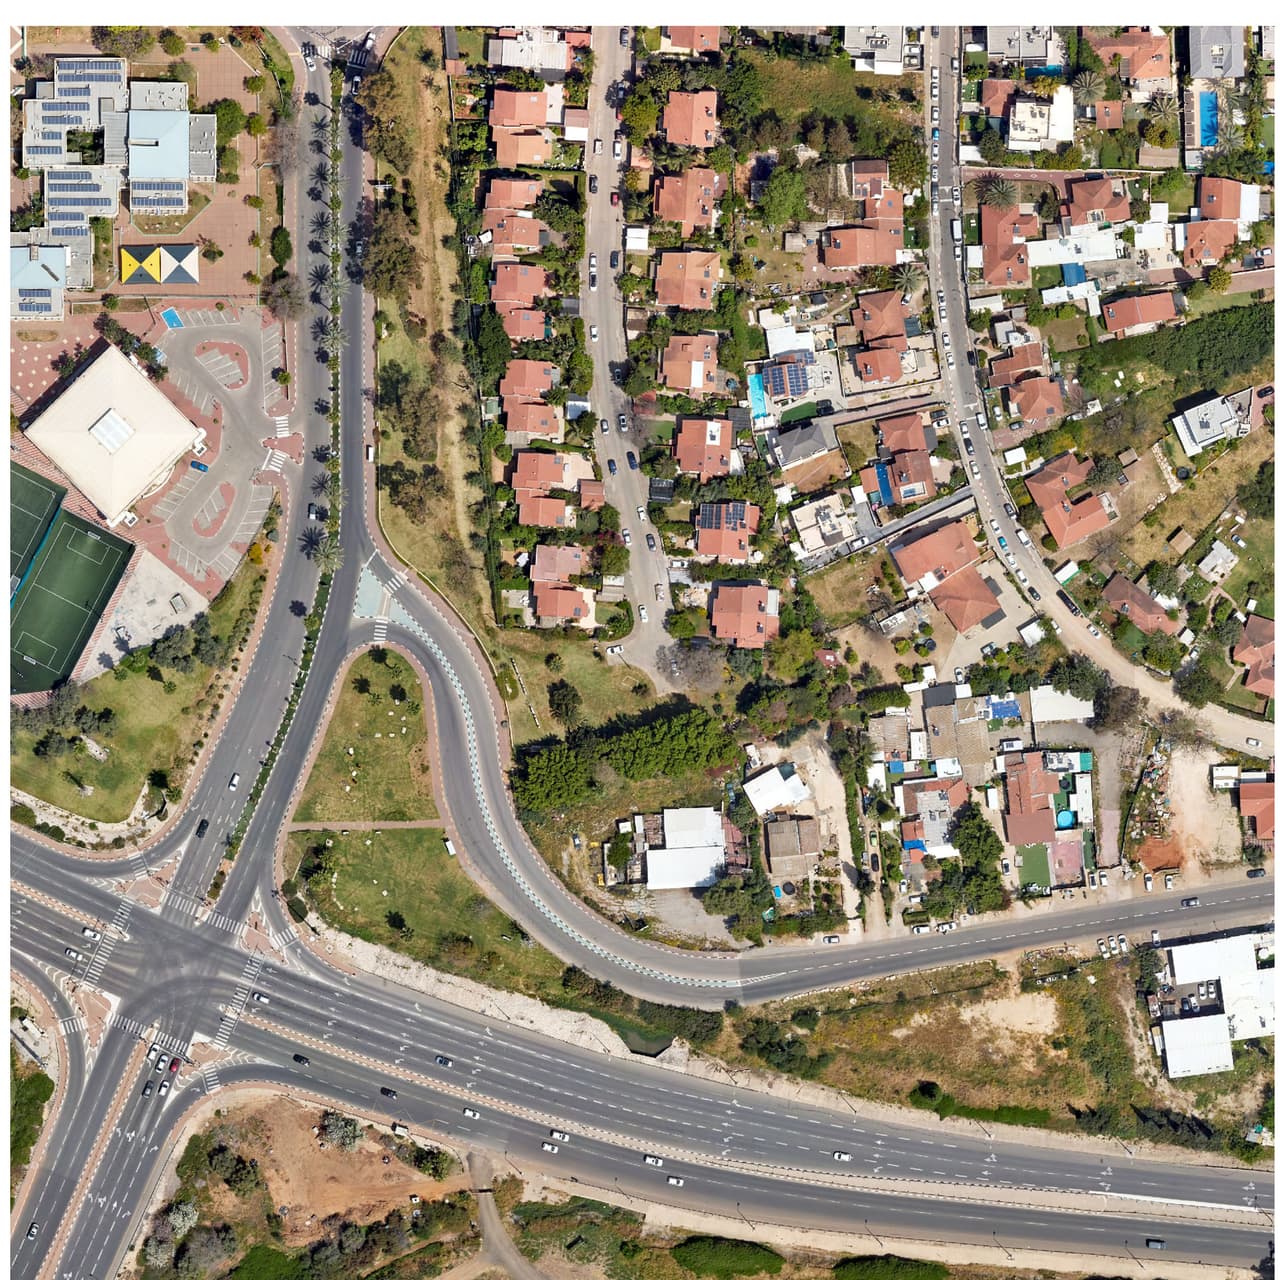
An OrthoGraphic survey turns a high-resolution orthophoto into a full set of GIS layers: buildings, pavements, light poles, manholes, signs, trees and more. AI detection speeds up interpretation, and human interpreters complete and check every feature. The result is a base map for a whole city, without assembling it layer by layer over years.
- Plan no.
- HG-V03
- Scale
- 1:1,250
- Sheet
- 03/06
- Updated
- 11.2026
What it is
From orthophoto to layers
An orthophoto is an aerial image that has been geometrically corrected, so every pixel sits at its true position in the Israeli grid and distances and areas can be measured on it. An OrthoGraphic survey is the next step: systematic interpretation of everything visible in the image, turned into vector features with attributes.
We developed the method at HAMMER under the name OrthoGraphic AI: automated detection, manual completion until the agreed layer list is fully covered, and human quality control on every feature. Building and tree heights come from a 3D surface model where one exists. Deliverables are GIS layers, a DWG file and PDF maps.


The challenge
Layer by layer is slow, costly and inconsistent
Setting up a GIS usually stalls at the data stage. Spatial data has been collected over time, from different sources and with different methods, so many layers are out of date and of unknown accuracy. A separate survey per layer takes longer, costs more, and the layers do not line up with each other.
An OrthoGraphic survey starts from one image of the whole area, with one date and one resolution, and produces all layers together. They share a single source, so they fit on top of each other.
The layers
Dozens of possible layers, chosen for your needs
The layer list depends on what the image resolution shows and on what your organisation needs. These are the main groups:
- Water and drainage Drainage inlets, manholes, culverts, channels and fire hydrants.
- Traffic and transport Roads, lane lines and separators, traffic islands, roundabouts, crossings, signs, traffic lights, bus stops, cycle lanes and parking.
- Public space and accessibility Pavements and kerb colours, junction accessibility, fences and sports grounds.
- Environment and vegetation Trees, shrubs and green areas.
- Poles Light poles and electricity poles.
- Buildings Building footprints, with heights from a 3D model where one exists.
The method
Five stations from image to layer
-
ST-01
Source
A current orthophoto from your organisation, imagery purchased from an aerial-photography provider, or drone imagery for a focused area. We check resolution, capture date, coverage and coordinate system.
-
ST-02
AI detection
Computer-vision models find features in the image and classify them into layers.
-
ST-03
Manual completion
Interpreters add what the model missed or misclassified, until the layer list is fully covered.
-
ST-04
Quality control
Every feature is checked by hand for position, class and topology. Heights are attached from a 3D model where available.
-
ST-05
Delivery
GIS layers, a DWG file and PDF maps, loaded into your ArcGIS Online or into HAMMER CITY.
Which, when
OrthoGraphic survey or photogrammetric mapping
It does not replace every measurement. It is the right tool for the right phase: first a complete picture of the whole city, then detailed measurement only where a project requires it.
-
Option A
Photogrammetric mapping
3D measurement from stereo imagery with ground control. Required for detailed engineering design and documents that call for certified survey. Relatively slow and costly.
-
Option B
OrthoGraphic survey
2D interpretation of an existing or updated orthophoto. Suited to base layers, inventory, day-to-day management and early planning. Faster and more economical, and it can be refreshed with every new image.
Uses
What the layers are for
- Setting up a GIS Base layers for the whole city on day one, instead of an empty system that fills slowly.
- Updating existing layers Compare old layers with a current image and fix what changed.
- Building-change survey Interpret buildings from two images of different dates and flag additions for inspection.
- Rooftop solar potential Net free roof area per building, from the building and roof layers.
-
 Heat and shade Canopies, surface materials and heights as inputs for street-level heat analysis.
- 3D city model Buildings with heights as the basis of a 3D city scene.
In development
What comes next: SEE.GMMA
SEE.GMMA is HAMMER's AI tool for mapping from aerial imagery, currently in development and pilot. It is built to process orthophotos at the scale of a whole city, with a full record for every processed tile and a GIS professional reviewing every result. The OrthoGraphic survey works today, with AI and human QA.
FAQ
Questions about orthophoto surveys
What is the difference between an orthophoto and a regular aerial photo?
A regular aerial photo is distorted by camera angle and terrain. An orthophoto is geometrically corrected (orthorectified), so every pixel sits at its true position in the coordinate system. That is why you can measure distances and areas on it and overlay GIS layers.
How many layers does an OrthoGraphic survey produce?
Dozens are possible, but the actual number depends on image resolution and on your needs. Anything not clearly visible in the image stays off the list. The layer list is agreed together at the planning stage.
Do we need new imagery, or can you use our existing orthophoto?
In most cases we can work from the orthophoto you already have, if it is recent and good enough. If it is old or low resolution, current imagery can be purchased from an aerial-photography provider, or a focused area can be flown by drone.
What does the AI do and what do people do?
The AI finds and classifies features, saving most of the manual work. Interpreters add what was missed, correct wrong classes and check every feature before delivery. No layer is delivered without human review.
What accuracy can we expect?
The layers cannot be more accurate than the imagery they come from, so accuracy is set mainly by the orthophoto's resolution and positional accuracy. At planning we review the source and agree in advance what it can deliver.
What can't an orthophoto show?
Underground utilities, features hidden under tree canopies or roofs, and details smaller than a pixel. When those are needed, we combine a foot or vehicle field survey in the same project.
Which formats are the layers delivered in?
GIS layers in the Israeli Transverse Mercator grid (ITM), as File Geodatabase or Shapefile, or loaded directly into ArcGIS Online. Plus a DWG file for AutoCAD users and PDF maps for presentation.
V-09
Have an orthophoto? You are halfway to a survey.
Send us the area boundary and the details of your current imagery, and we will check which layers it can yield and at what level of detail.