
HG-V02 Infrastructure survey
What runs under the street, and what lights it.
An infrastructure survey maps your drainage, street lighting and water assets as GIS layers: every inlet, manhole, pole and meter, with a location, attributes and a photo. Engineering and operations teams can then plan maintenance by what is in the field, not by old drawings.
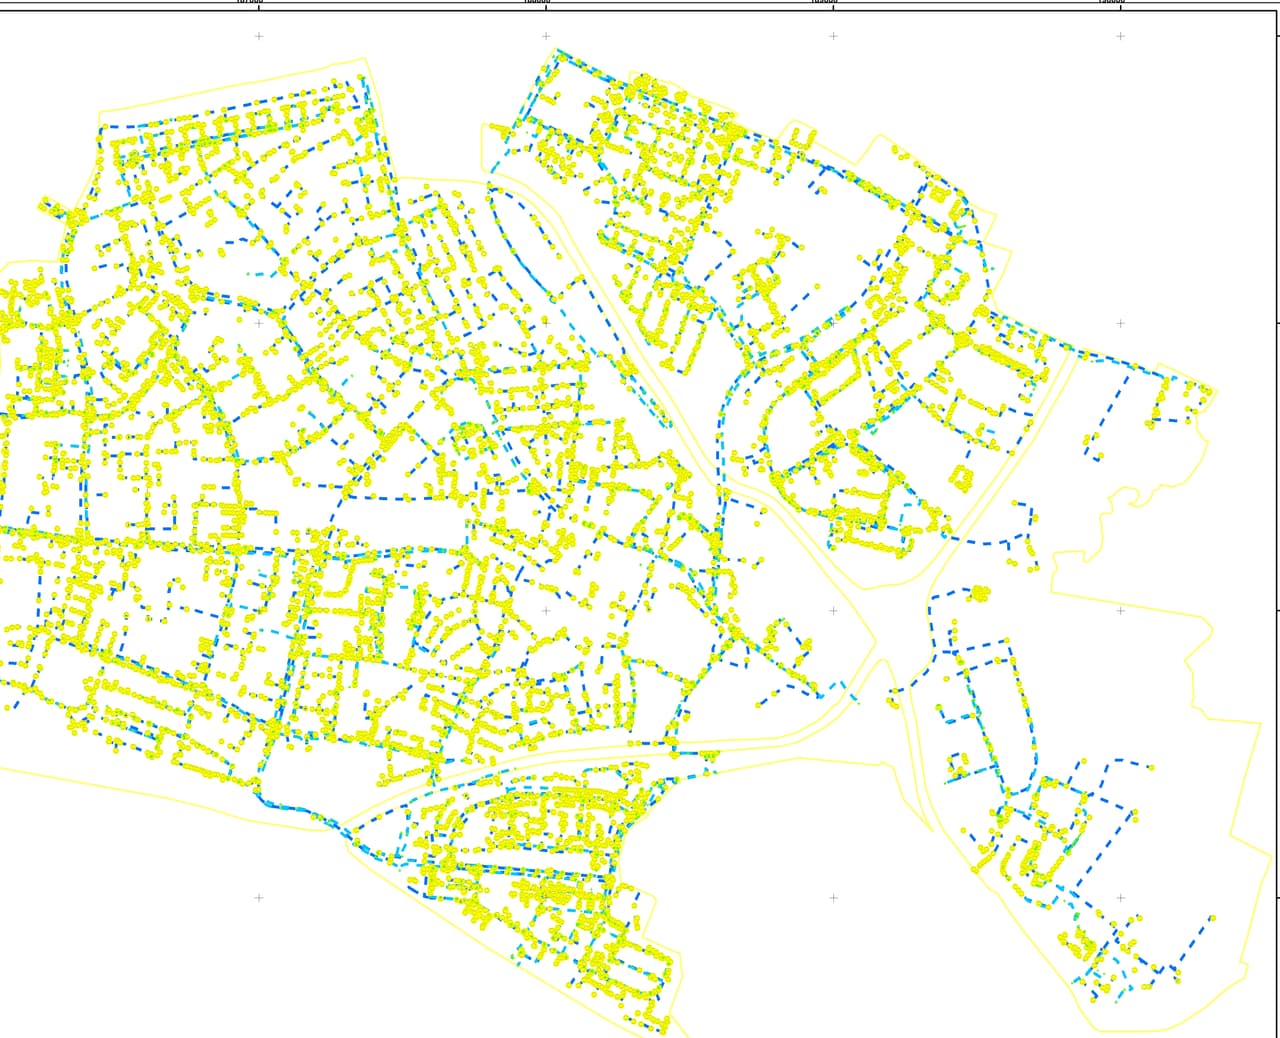
- Plan no.
- HG-V02
- Scale
- 1:1,250
- Sheet
- 02/06
- Updated
- 11.2026
What it is
An infrastructure network you can rely on
An infrastructure survey is the systematic mapping of municipal network assets, such as drainage inlets, manholes, pipes, light poles and water meters, stored as GIS layers with attributes, photos and the links between components.
In many municipalities, infrastructure knowledge is scattered across paper plans, contractors' AutoCAD files, old layers and the memory of long-serving staff. A survey brings all of it into one network, checks it against the field and leaves you with a layer you can maintain.


What we map
Three networks, a layer for every component
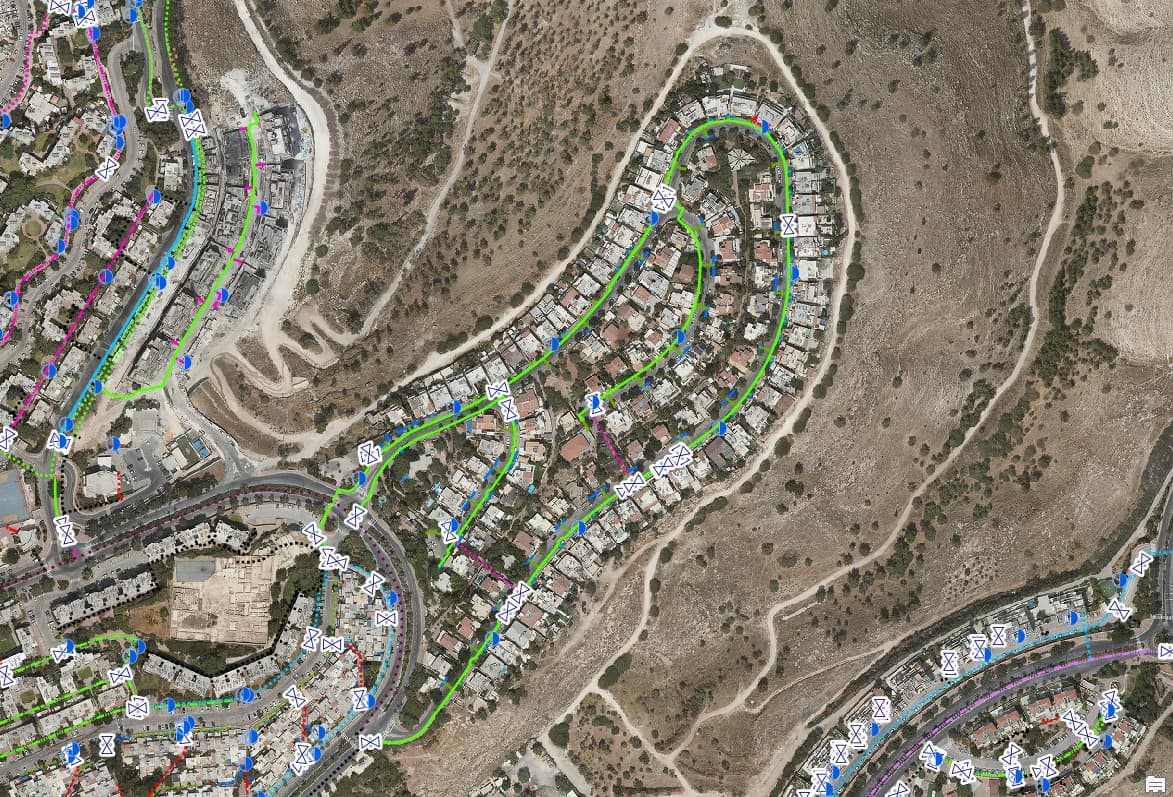
- Drainage Inlets, manholes, pipes, culverts and channels. We combine digitising existing drainage plans with orthophoto interpretation and field checks, and build a network where every pipe connects to a manhole.
- Street lighting Every pole is numbered with a durable tag and photographed. Each record holds height, type, number of fixtures, arm length and colour, and is linked to the lighting control cabinet that feeds it.
- Water Fire hydrants and water meters, including irrigation meters, with location, ID and photo.
- Depressions and flood spots Elevation-model analysis to find low points where water collects, as a basis for prioritising drainage works.
How it works
From the old plan to a verified network
-
ST-01
Gather what exists
Drainage and lighting plans, contractors' as-built files and old layers. What already exists goes into the work instead of being surveyed again.
-
ST-02
Interpret from the air
Whatever is visible from above, such as manhole covers, inlets and poles, is mapped from the orthophoto as a base layer.
-
ST-03
Verify in the field
Surveyors walk the area, verify, complete, number and photograph each component, using a digital form with fixed value lists.
-
ST-04
QA and topology
We check completeness and attributes, and check that the network is continuous: every pipe reaches a manhole and every pole belongs to a control cabinet.
-
ST-05
Delivery
GIS layers, AutoCAD, Excel and PDF files, and an interactive management map that also shows survey progress live.
Deliverables
What you get
- Network layers Points, lines and polygons in the Israeli grid (ITM), with a unique ID for every component.
- A photo for every asset Each manhole, inlet and pole has a linked photo that helps crews identify it on site.
- Files for every department GIS for the system team, AutoCAD for engineers, Excel for operations and PDF for presentations.
- Management map An interactive map for managing the network, which also shows what has been surveyed while work is under way.
As-built plans
Convert contractors' as-built plans instead of retyping them
Every infrastructure job ends with an as-built (AS-MADE) plan in DWG. Instead of retyping it into layers, CADabra converts AS-MADE surveys into GIS layers according to the national mapping specification, with a quality grade and a report. The infrastructure layer is then updated with every finished job, not only at the next survey.
FAQ
Questions about infrastructure surveys
What does a drainage survey include?
Mapping of inlets, manholes, pipes, culverts and channels, with attributes and a photo for each component. We combine existing drainage plans, orthophoto interpretation and field verification, and deliver a continuous network as GIS layers.
Does the survey include depths and gradients?
A GIS survey maps the position and attributes of what can be seen and verified in the field. Cover and invert levels and pipe gradients are engineering measurements made by a licensed surveyor. If the project needs them, we define that in the survey plan up front.
What is recorded for each light pole?
A pole number on a durable tag, a photo, height, type, number of fixtures, arm length and colour, and the lighting control cabinet that feeds it. More attributes can be added to suit the electrical department.
Can contractors' as-built plans be loaded into the layers?
Yes. CADabra converts AS-MADE DWG files into GIS layers according to the national mapping specification, with a quality report. That lets you update the infrastructure layer after every job without manual retyping.
What happens to our existing infrastructure layers?
They are the starting point. We check them against the field, correct and complete them, and mark what was verified and when. We do not start from scratch if there is something to build on.
How can we follow survey progress?
During the work you get an interactive map that shows what has been surveyed, so you can track progress by neighbourhood or street and start using the data before the survey ends.
V-07
Which network comes first?
Drainage before winter, lighting before a fixture replacement, or water before an irrigation plan. Tell us what is urgent and we will scope a survey around it.